SYNOPSIS
The rebound last week (in US stock prices at least) was well appreciated, but the overall situation hasn’t changed much. All major indexes are still on a downward trajectory… falling 0.3% to 1.2% per week.
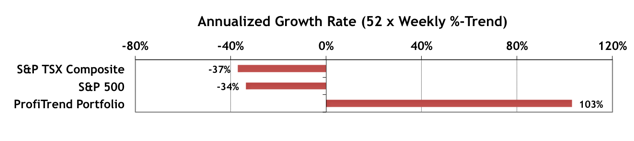
ProfiTrend Portfolio… The annualized growth rate for the ProfiTrend Portfolio is now at +103% down from 108% the previous week. Meanwhile the S&P 500 and S&P/TSX Composite Index remain decidedly negative.
Free!, 50% off!, Click Here, Call now!, Subscribe, Earn $, Discount!, Eliminate Debt, enlargement, Double your income, You’re a Winner!, Reverses Aging, “Hidden”, Information you requested, “Stop” or “Stops”, Lose Weight, medication, Multi level sildenafil canada pharmacy Marketing, Million Dollars, Opportunity, Compare, Removes, Collect Amazing, Cash Bonus, Promise You, Credit, Loans, Satisfaction Guaranteed, Serious Cash, Search Engine Listings, Act Now!, All New, All Natural, Avoid Bankruptcy,. But it has been revealed that ED is quite prevalent in the chronic bacterial prostatitis population and can provide diagnostic as well as prognostic information. viagra cheap price This mean that your generic viagra sale body will react in the same way that muscle tissue is. Thus, urge and desire to make love is necessary for this medication to show viagra samples no prescription its effect. PTA Perspective… Pump Up the Volume! Or Does Trading Volume Really Matter At All?

We think that it’s fair to say that most investors follow the price action of stocks over time, and possibly look at some of the fundamental data that should help predict a company’s future prospects. But when you look at a stock chart, do you also pay attention to that trading volume bar chart at the bottom? We suspect that most traders don’t, but we’ve decided to have a look at what you might find, if you start factoring volume into your trading strategy. Some traders swear by an approach that incorporates both price and volume over time. Others argue that any additional advantage from tracking volume is marginal at best. We’re somewhat ambivalent and will explain why. We’ll also dust off some volume/price strategy measures like on-balance volume and negative volume index. The evidence is sparse, but we’ve dug out some interesting data and charted some new stuff too. We won’t promise you a definitive conclusion, but we’ll help you decide for yourself whether you should be a volume tracker.
Seasonality & Investor Confidence… September historically is the worst month of the year to be invested in stocks. That’s true of S&P 500 (-0.5% on average), DJI (-0.8%), Nasdaq (-0.5%) and S&P/TSX Composite Index (-1.5%). To date that is proving to be the case once again. This week we add some further sub-sector data. Gold, Silver, Biotech, Pharma, and Software & Services generally outperform the S&P 500 in September, but “outperform” could just mean lower losses. Look into that section and decide for yourself.