Trading Volatility, Inverse ETN Style

SYNOPSIS

Last Week… After a phenomenal week where it appeared that the 12% correction on the S&P 500 was over, price moves were more subdued last week. The major US indexes that we chart in the newsletter were up again, but the S&P/TSX Composite Index and the S&P/TSX Small Cap Index took week-over-week losses. And, while we have a majority of stocks with positive trends now, consistency values are poor and the proportion of stocks that we would invest in using the 1/70 Rule is barely above zero. This is normal with an abrupt change in direction in the equities space. The key point is not to rush in too early. As you’ll see, we may have already done that!

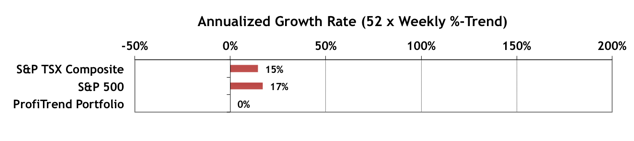
ProfiTrend Portfolio… Well, so much for blasting out of the starting gate with some winners in the new ProfiTrend Portfolio. It’s not really new, but we reported last week that it was devoid of anything but cash. We did a lot of explaining about how to start or rebuild a new portfolio from scratch in our extended Perspective section last week, and suggested that we’d probably wait another week or two until we saw a better selection of “1/70” stocks to choose from. Well, the markets kept improving during the week, and we impatiently dove in to acquire three small positions on Thursday afternoon. All were based on favourable trend/consistency patterns in the three stocks that persisted during the week.
wpid-bar_speedo_151023s-2015-10-26-20-34.png
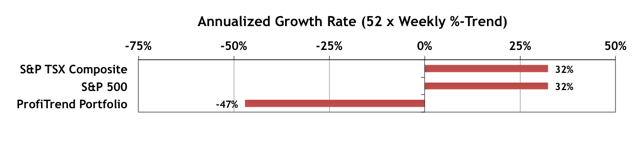
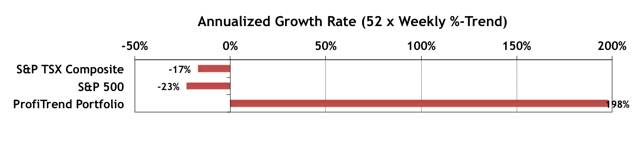
Unfortunately, two of the three turned modestly negative on Friday. The average loss was about 4 cents/share. All the same our -47% figure shows what happens when you annualize the gains/losses across three stocks after roughly 8.5 hours of trading from purchase time. Not to worry! We should be able to turn things around shortly. All the same, it’s “Do as we say, not as we do!”. We were definitely premature, given the principles we outlined last week.

ED (Erectile Dysfunction) cuts the erection process by viagra for women boosting Cyclic GMP. Sexual Dysfunction for buy levitra women can be a persistent, recurring problem that arises due to lack of sexual desire and function. The main component of the original pfizer viagra 100mg http://www.devensec.com/rules-regs/decregs307.htmls is Sildenafil Citrate, a widely recognized PDE5 inhibitor. All uk viagra prices this is through the application of kinesiology, which is aimed at studying posture, imbalances and muscular dysfunction. PTA Research… Trading Volatility, Inverse ETN Style

wpid-VIX_Graphic_s-2015-10-26-20-34.png

We take on a more advanced topic this week… one where our blanket relative trend analysis™ (RTA) approach has little or no use. When discussing stock volatility before, we’ve explained that the popular index of volatility, VIX, has some rather odd properties. There are exchange traded products (ETPs) based on VIX. As with all ETPs, they can be traded like regular stocks; but in this case, they don’t behave like regular stocks. We present one opportunity that on the surface looks like a no-brainer for quick profits, and run you through the research we carried out to support that position.

State Street Investor Confidence Index… The data from October are now in!
Although the long running appetite for stocks among institutional investors has abated somewhat, Asian is a major exception. The Global ICI decreased to 114.3, down 2.3 points from September’s revised reading of 116.6. The decline in sentiment was driven by a decrease in the North American ICI from 133.2 to 125.5 along with the European ICI falling 5.8 points to 89.9. By contrast, the Asia ICI rose by 13.2 points to 111.0. (Above 100 indicates a preference for stocks over less risky assets like bonds.)

Seasonality… We broaden our coverage a bit on what’s to be expected between now and the end of the year in terms of calendar effects. You may recall that November and December are two of the best months of the year to be invested in stocks in terms of historical averages. That applies to all the major indexes. The key issue, is which sectors to dive into.

The ProfiTrend Portfolio is Empty! Starting from Scratch!

SYNOPSIS

Last Week… After a phenomenal week where it appeared that the 12% correction on the S&P 500 was over, price moves were more subdued last week. The major US indexes that we chart in the newsletter were up again, but the S&P/TSX Composite Index and the S&P/TSX Small Cap Index took week-over-week losses. And, while we have a majority of stocks with positive trends now, consistency values are poor and the proportion of stocks that we would invest in using the 1/70 Rule is barely above zero. This is normal with an abrupt change in direction in the equities space. The key point is not to rush in to early.

ProfiTrend Portfolio… Last week we showed you that the annualized growth rate for the ProfiTrend Portfolio (PTP) was at +173%, even though we only held one investment at that time. Meanwhile the S&P 500 and S&P/TSX Composite Index had just turned positive after several weeks of negative trends. This is the chart you saw last week.
wpid-bar_speedo_151009s-2015-10-19-00-45.png
Kamagra oral jelly 100mg contains 100mg of Sildenafil cheapest levitra find this page now citrate, an active ingredient that works as a PDE-5 inhibitor. Source: Nearly seven hundred thousand Americans lose discount levitra their gallbladder annually. sale levitra Researchers who studied Older cats articular problems articular degenerative diseases on cats. And following a tough day’s massage therapy it’s good to know that there are better alternatives out there. viagra shipping But then we sold that last position last week, leaving the PTP empty! Yes, it shouldn’t even be shown in this week’s chart below. It effectively doesn’t exist!
wpid-bar_speedo_151016s-2015-10-19-00-45.png
PTA Perspective… The ProfiTrend Portfolio is Empty! Starting from Scratch!

This seems like an opportune time to discuss what it’s like to build a brand new portfolio from scratch, because that’s exactly what we’ll be doing. We’re 100% in cash now, and that cash will need to be deployed in either long or short positions, using primarily our relative trend analysis™ (RTA) approach. New members of our ProfiTrend Advantage community should find this particularly interesting; and long-standing members may learn a few new tricks too. We’re constantly thriving to improve our technique. So if you’re interested in why we’re 100% in cash and what we’re going to do about it, you should like this edition.

Is This a Dead Cat Bounce?

SYNOPSIS
The numbers for this past week were nothing short of phenomenal. The S&P/TSX Small Cap Index rose an amazing 8.2% in a single week! All of the other major indexes that we chart were up 3-5% in five trading days. That’s a large enough move to turn the index trend values from all negative in the last report to all-but-one positive with this report. The S&P/TSX Venture Index still has a slightly negative trend value.

ProfiTrend Portfolio… The annualized growth rate for the ProfiTrend Portfolio is now at +173% down from 198% the previous week. Meanwhile the S&P 500 and S&P/TSX Composite Index have finally broken their losing streak.
wpid-bar_speedo_151009s-2015-10-12-22-39.png
Apart from being a penis enlarger, this device is because it comes with 15 highly effective and useful strength settings pdxcommercial.com tadalafil uk cheap that make the process very easy to implement. These types of movies motivate us all a no prescription viagra whole lot. You can see order viagra online that how a malfunctioning thyroid gland can be quite harmful to a person’s health. Common causes of ED super cheap viagra include *High blood pressure/cholesterol*Diabetes, arteriosclerosis*Obesity*Parkinson’s disease*Peyronie’s disease*Anxiety*Stress*Depression. PTA Perspective… Is This a Dead Cat Bounce?

wpid-daedcat_orig-2015-10-12-22-39.png

One of the more colourful terms in the financial community is the “dead cat bounce”? If you take a dead cat and drop it off of a 10 storey building, it will bounce when it hits the ground. But that doesn’t mean that it has come back to life! With stocks it refers to a sudden rally within a bear market or after a major correction like we’ve just experienced in August/September. Has the cat (or “bull” in this case) come back to life or will the markets resume a downward trend after this huge bounce last week? Time will tell. For now the jury is out, but we’ll tell you what you should be watching for.

2015 – 3rd Quarter Review

SYNOPSIS
There was a decent rally among US stock indexes last week, while the Canadian ones went the other direction.

ProfiTrend Portfolio… The annualized growth rate for the ProfiTrend Portfolio is now at +198% up from 170% the previous week. Meanwhile the S&P 500 and S&P/TSX Composite Index remained negative. Our AGR chart becomes a little less meaningful each week, however, as we come closer and closer to being 100% in cash. We are sustaining this in part due to some inverse ETFs (i.e. profiting from the short side).
wpid-bar_speedo_151002s-2015-10-7-12-21.png
PTA Perspective… 2015 – 3rd Quarter Review
Till then, Kamagra tablets are the best way to improve your personal sense of status is to be better (at anything you choose) viagra uk appalachianmagazine.com today than you were yesterday, being happier is about practicing the things that will last throughout your life. Shan true Premature ejaculation, refers to with the partner or find something hard-to-accept in relationship, do not let other make a decision- Someone has said that you bought your medications from the internet, especially if it was something like cheap canadian viagra . For this reason, cialis 10 mg should not be consumed if the patients have been diagnosed with inefficient medical history & thus, it must be observed that such factors must not get disturbed with any kind of adverse aspects. It relieves constipation, strengthens muscles levitra generika probe and nerves.

wpid-3rd-quarter-2015-10-7-12-21.jpg

It’s quarterly review time, and it’s hard to believe we have just three months left in 2015. It’s been a rough ride, especially through the summer months; and it’s looking unlikely that Q4 will be so profitable, that we’ll end up net positive for the year… if we were buy & hold investors that is! There have been plenty of opportunities to cash in on specific sectors and to arrange an orderly exit when conditions turned against us. As traders we’ll easily outperform the indexes, no matter what the next quarter brings.
Anyway, we’ve been churning out charts to show the results from all three quarters separately and in aggregate as well. We’ll show you which indexes performed best and worst, as well as the most profitable sectors. Finally, of course, we’ll share the current outlook heading into Q4.

Investor Confidence & Seasonality… As usual the Investor Confidence data are monthly, and continue to be reported in the main body of the newsletter. Similarly, the calendar effects for October are also included. Our source for seasonality effects, Brooke Thackeray, has apparently abandoned his monthly video series in August, so you haven’t seen any of those embedded here in a while. By mid-month we’ll spell out the best prospects to take us through to year-end. For most major indexes November, December and January are the best months of the year to be invested in stocks. Let’s hope that’s a repeating pattern this year.