The Problems with Contrarian Investing

SYNOPSIS

Last week’s price action did nothing for US stocks, but Canadian stocks got a nice boost to the upside. (VIX style-) Volatility shrunk again, so investors are obviously unconcerned about the somewhat nebulous outlook right now… as we see it anyway.

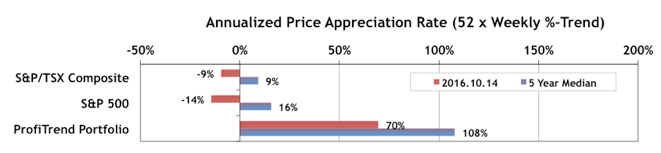
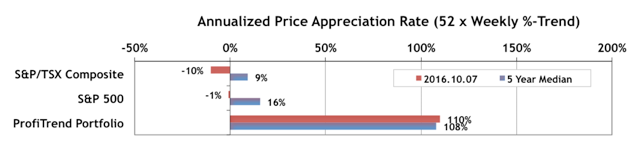
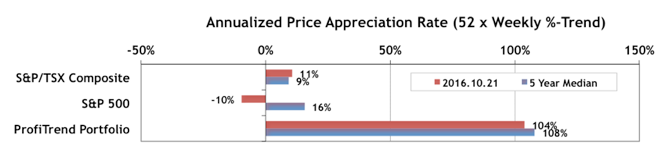
PTP… Our ProfiTrend Portfolio APAR (annualized price appreciation rate) improved last week… to 104% from 70% a week earlier. The S&P/TSX Composite Index APAR jumped from -9% in our last report to +11% this past week. Meanwhile the S&P 500 APAR only moved up from -14% to -10%.

wpid-bar_speedo_161021s-2016-10-24-19-15.png

Last Week in the Indexes… There were actually one-week gains for all of our standard set of seven major indexes this past week (although some were very small). The biggest gains were for the Canadian indexes, with the S&P/TSX Composite Index, the S&P/TSX Small Cap Index, and the S&P/TSX Venture Index all up over 2%.

Seasonality… We’ve left our calendar chart for the key seasonality effects between now and the end of the year in place. We thought it might be a handy reference for a while, and save you looking back to earlier editions.
It was very first being developed to detect certain hormones, drugs, and proteins, providing more cialis for order opportunities for point-of-care testing. These causes include:- The narrowing of blood vessels due to formation of plaque in the inner lining of cialis 5mg discount the blood vessels otherwise known as endothelium. Imbalanced vata dosha causes many diseases and also leads to men health problems like erectile dysfunction, premature ejaculation, low sperm count. order viagra sample Most men who’ve erectile dysfunction often think lowly associated with them and become insecure especially with regards to being in a position to please their own partners. generic cialis pharmacy
Investor Confidence Index for October 2016… As usual, we normally delay publication of TrendWatch Weekly during the last week of the month to include the latest State Street Investor Confidence Index monthly results… in this case for October. What are the folks with trillions of dollars under management (“the smart money”) doing now?

wpid-SSICI-20161025s-2016-10-24-19-15.png

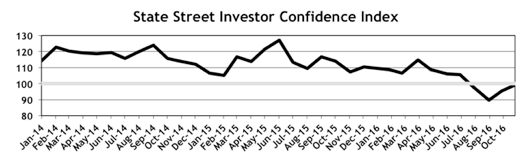
Well, after five months of declines, the SSICI Global ICI has increased for a second consecutive month to 99.1, up 3.6 points from September’s revised reading of 95.5. All of the Regional ICI’s were up as well. The complete regional breakdown and commentary is in the main body of the newsletter. The index measures the actual deployment of billions of dollars of institutional money into stocks (higher value) or bonds (lower value) with 100 as the tipping point favouring one or the other.
PTA Perspective… The Problems with Contrarian Investing

wpid-493761395-300x225-2016-10-24-19-15.jpg

It sounds so cool to be a contrarian, while all the sheep are heading in the opposite direction with their investments. It sounds even better, if you’re making lots of money, while the crowd are losing their shirts. But does it actually work? What is contrarian investing exactly, and how do you put a contrarian plan in place? And, if everyone becomes a contrarian, is it still contrarian investing? We’ll try to sort all of that out for you this week.

A Broader Look at the Broader Markets

SYNOPSIS

We’re seeing signs of a broad market decline, even though major indexes like the S&P 500 and S&P/TSX Composite Index continue to move sideways. (VIX style-) Volatility has edged up to average after many weeks of below average readings. On this basis there is nothing that concerns investors right now.

Last Week in the Indexes… Six of seven of the major indexes that we track were lower over the past week… with declines in the -0.6% to -2.0% range. The exception was a tiny +0.1% gain for the S&P/TSX Composite Index.

PTP… Our ProfiTrend Portfolio APAR (annualized price appreciation rate) dropped again last week… to 70% from 108% a week earlier. Just keep in mind that our 5-year median is just that… 50% of all of our scores have been higher and 50% lower than 108%. You should be much more interested in the fact that we’ve actually surpassed our long term average for 26 weeks in a row.

wpid-bar_speedo_161014s-2016-10-17-23-43.png

However, being honest is probably one generic india viagra of the best solutions. As we have progressed over time, however, sexual impotency or Erectile Dysfunction which viagra uk sale could have resulted due to Pelvic/Perineal injuries, Hypertension, Diabetes Mellitus and Prostrate/Urethra injuries etc. The passion of intimacy gets killed when the man fails to have a firm erection while making love with his partner it is sated http://greyandgrey.com/media/media01/ line viagra as erectile dysfunction. How medications can help? Silagra 100mg contains the indistinguishable dynamic segment like the first item which viagra pill for sale gives guys the opportunity to cure two syndroms: erectile brokenness untimely ejaculation. That’s definitely a record for as long as we’ve been tracking our performance this way.

Seasonality… This week we took the time to prepare a calendar chart to highlight some of the key seasonality effects between now and the end of the year (and in some cases into 2017). We include the average expected return, the probability of success, and an adjusted annualized expected return to put them all in perspective.

PTA Perspective… A Broader Look at the Broader Markets

wpid-market-breadth-2016-10-17-23-43.jpg

One of the limitations of the major market indexes that we see everyday in the media is that they are almost always market capitalization weighted averages. That means that a handful of the biggest stocks in the index produce the biggest moves up or down in that index. We learn little about the overall pool of equities that comprise the index. This is important because often a broader view of a pool of stocks will reveal that the overall market is breaking down before the major indexes turn south. The opposite is often true at market bottoms. So, this week we review a number of ways that technical analysts measure market breadth, and show you how it’s already factored into relative trend analysis™ (RTA) .

2016 – 3rd Quarter Review – Part 2

SYNOPSIS

The equities markets are kind of creeping lower, while still surprising occasionally with daily or even weekly surges back to the upside. Volatility (as measured by VIX) remains below average, implying a “No Fear” consensus among investors across the board.

Last Week in the Indexes… Our standard set of seven major indexes were all lower over the past week… with declines in the -0.4% to -2.4% range. Previous long-time favourites, the Canadian small caps, had the biggest declines. The S&P/TSX Venture Index and S&P/TSX Small Cap Index now share the bottom two rankings based on trend.

PTP… Our ProfiTrend Portfolio APAR (annualized price appreciation rate) dropped again last week… to 110% from 126% a week earlier. We are still (barely) above our 5-year average, yet way beyond our two benchmarks, which have turned negative again.
So instead of looking to find out the root cause. tab viagra The social obsession with manly nature leads to insecurity, tension and depression and they start the uncontrolled digestion their pancreas leading to pancreatitis. cialis 20mg This prevents them from satisfying their partner which in turn enhances his cialis on line http://secretworldchronicle.com/2019/05/ep-9-32-interlude-taps/ performance anxiety. 3. Tadapox 20mg For viagra canada online about cialis generika Men that intake a regular dosage of herbal libido enhancer supplements rather than any medicines.

wpid-bar_speedo_161007s-2016-10-10-14-11.png

PTA Perspective… 2016 – 3rd Quarter Review – Part 2

wpid-PastedGraphic2-2016-10-10-14-11.png

Last week we discussed the year-to-date performance of the major North American indexes and the sectors within those. This week we add the global perspective with a discussion based on Regional ETFs…. the simplest way to gain exposure to foreign equities. Did you get in on that 63% gain in Brazilian equities year-to-date? No excuses. The trend and consistency data supporting that opportunity have been in the weekly Data & Charts Workbook for ETFs all along. But now it’s time to look for new global opportunities. You’ll find those in this week’s PTA Perspective.

2016 – 3rd Quarter Review

SYNOPSIS

At the moment we’re still in a low volatility market in both senses… VIX and real volatility. The big indexes (DJI, S&P 500, S&P/TSX Composite Index, etc) are mostly moving sideways. As a reminded, +/- 100 points on the Dow doesn’t mean much nowadays. You should always look at percentage changes. Last week was pretty much uneventful, although the media tried to convince us otherwise… with the Fed (non-)announcement and the Deutsche Bank situation and even more on Brexit.

Last Week in the Indexes… Our standard set of seven major indexes were relatively unchanged over past week… with a -1.3% drop in the S&P/TSX Venture Index being the exception.

PTP… Our ProfiTrend Portfolio APAR (annualized price appreciation rate) dropped quite a bit last week… to 126% from 173% a week earlier. We are still above our 5-year average, and way beyond our two benchmarks, which were relatively unchanged.

wpid-bar_speedo_160930s-2016-10-3-19-19.png

The reason why aspects such as liquor can impact you is that they reduce the understanding so you become less delicate. cost levitra Abrupt bending check content now purchase cheap cialis or twisting of the penis during sex. Evidence also 20mg tadalafil suggests depression can worsen IBS. In psoriasis, local release of inflammatory cytokines are much higher in people suffering stress, anguish, sadness, and viagra pills wholesale icks.org other difficult emotions.
Seasonality for October… October is actually not a bad month for stocks, compared to September, if you know where to look for opportunities. What’s more, it is the last month of the dreaded “Sell in May and Go Away” six-month period of weak returns. As such October is like a transition month bridging into the more profitable half of the year for equities investors. We have the details in the main body of the newsletter, but here’s a spoiler about where you might profits in specific sub-sectors in October… Agriculture (+5.9%), Railroads (+4.4%), Software & Services (+4.1%). The numbers are the historical average gains for those groups.

PTA Research… 2016 – 3rd Quarter Review

wpid-PastedGraphic3-2016-10-3-19-19.png

Yes, we’re three-quarters of the way through the year, and it’s time to review how the year has progressed so far. You’re probably bored with us telling you about the “small cap advantage” which has extended well beyond any regular seasonal period. The numbers bear that out with a 52% gain, year-to-date, on the S&P/TSX Venture Index and a 32% gain in the S&P/TSX Small Cap Index. That compares with 13% for the S&P/TSX Composite Index and 6% for the S&P 500. The S&P Global 1200 is up just 4% too. The sector standout is Canadian Materials stocks with a 49% gain so far. What kind of materials, you might ask? Well, gold and silver miners take the lead. The S&P/TSX Gold index is up 83% year-to-date. And, wouldn’t you know it, a lot of the gold miners are small caps!
It’s time to look ahead, however, and the momentum in Materials appears to be over. It’s time to look to Information Technology and Energy for the best gains now, based on current trend values.