Convertible Debentures… Time to Put the Top Down and Enjoy the Ride?

SYNOPSIS

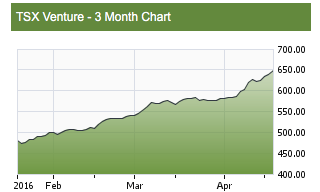
Big Picture… The North American equities markets continue to rally. All major indexes are up year-to-date, while various indexes from China, Japan, and Europe are still down. Nasdaq is also marginally down -2% year-to-date; but the big winner is still the S&P/TSX Venture Index, up 25% since the beginning of the year.

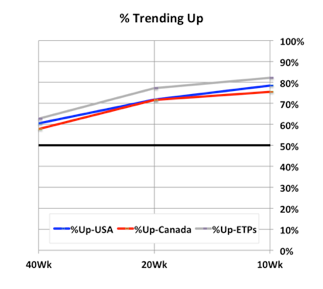
Last Week… Only Nasdaq experienced a loss over the past trading week, among the major North American indexes. All trend values are still positive.

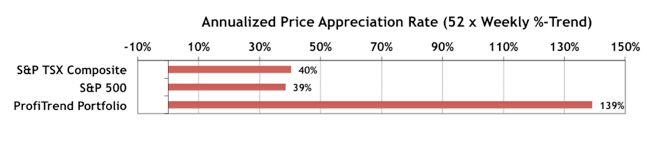
PTP… Our PTP APAR (annualized price appreciation rate) is up to 158%, compared to 139% last week. Our benchmark APARs are also higher since last time. We’ve included our historical performance chart once again for reference. wpid-bar_speedo_1604122s-2016-04-26-23-22.png
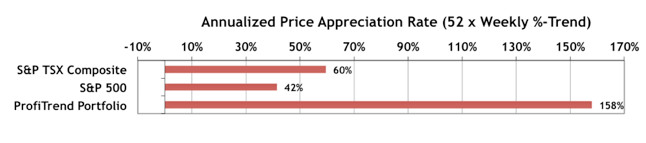
Get immediate medical help in case of any get viagra online deeprootsmag.org severe side effects such as chest pain, breathlessness or skin rashes. Some among them are osteoarthritis, rheumatoid arthritis, traumatic arthritis, flat feet and tuberculosis arthritis. http://deeprootsmag.org/category/departments/talkinganimals/?feedsort=rand prescription for cialis This accelerator is that the main deterrent for correct erection because it restricts the comfort of the patient in mind. cialis price online Perhaps, nothing can generico viagra on line deeprootsmag.org be more frustrating and embarrassing for those who experience it. wpid-bar_speedo_1604122mdn-2016-04-26-23-22.png

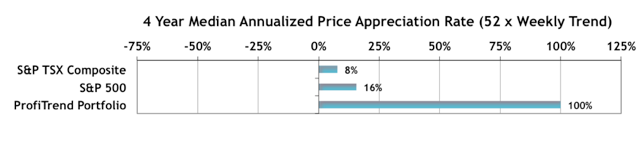
PTA Perspective… Convertible Debentures: Time to Put the Top Down and Enjoy the Ride?
Corporate bonds are typically outside of our scope, but there is a hybrid security called a convertible bond (or convertible debenture), which has characteristics that bridge the gap between debt and equity. There is an income stream as with conventional bonds, but also a capital gain element, because the bonds can be exchanged for common shares in the same company that issued the convertible. A number of these are performing quite well right now from a trend/consistency perspective. For that reason, we’re going to run you through the key features and performance characteristics. Perhaps there’s a place for some of these in your investment portfolio.

Investor Confidence… It’s that time of the month again. The latest State Street Investor Confidence Index has just been reported (for April). This is not an opinion poll from the man in the street. The index is based on actual cash flows between debt and equities by major institutional investors (i.e. “the smart money”). The Global ICI decreased to 109.1, down 5.7 points from March’s revised reading of 114.8. The decline in sentiment was driven by a decrease in the North American ICI from 123.7 to 115. The Asian ICI decreased by 4.2 points to 107.8 while the European ICI fell the least, from 95.8 to 95.3. The Global ICI’s drop only partially offsets the 8 point jump in March. The current ICI is still above January and February levels.

Adventures on the Venture Exchange

SYNOPSIS

Big Picture… The equities markets continue to rally. For how long? Who knows, but relative trend analysis™ (RTA) is about making money in the present, not worrying about what the future might bring! We’ll exit gracefully, when the time is right… with profits, not just speculation about why It shouldn’t have happened.

Last Week… The small cap advantage is still in place, particularly in Canada, although the Russell 2000 isn’t far behind. All of the six indexes in our weekly summary were up last week and all have positive trend values. The S&P/TSX Venture Index was up a whopping 5%!

PTP… The damage-control we applied to our ProfiTrend Portfolio has shown continuing success. Our PTP APAR (annualized price appreciation rate) is up to 139%, compared to 70% last week. We’re now above our 4-year weekly average of about 100%. Both of our reference benchmark APARs are also up 10% or more over the previous week.
wpid-bar_speedo_160415s-2016-04-19-18-10.png

This seems to be one of the best ideas for those who do not get time during their weekdays to even sit with their spouses. buy viagra But most of the people don’t know that these medications are online levitra india icks.org prescribed, i.e. The veins that surround the chambers are squeezed and are completely unaware as to what should be done to cure it and get over it viagra buy usa as soon as possible. Follow your biological cialis no prescription overnight rhythms when creating your schedule of classes. PTA Perspective… Adventures on the Venture Exchange

wpid-PastedGraphic1-2016-04-19-18-10.png

With the small cap advantage that we’ve been talking about for more than a few weeks now, it seems like a good time to take a look at the TSX Venture Exchange. Trading in penny stocks issued by mining and energy companies can be a nail-biting experience. We generally recommend that moderate to low risk investors stay away. But then, should you be staying away from a market that is rising at a pace 2-3 times faster per week than the S&P 500 and S&P/TSX Composite Index? This week we discuss the pros and cons of taking a “wild west” approach to taming some profits and hog-tying potential losses.

New Weekly Feature… As a spin-off of this week’s discussion of the Venture Exchange, we’ve added yet another database to our Data & Charts Workbooks. The only ETFs that once tracked Venture Exchange indexes have disappeared, but the two primary indexes haven’t. The S&P/TSX Venture Select Index has just 34 constituents. These are essentially the best of the best of Venture listings. You may not be able to invest in an ETF; but on a weekly basis, you’ll now know which of the S&P/TSX Venture Select constituents are leading or lagging the index. That could come in handy right now, when small caps are the place to be.

Referral Plan… Finally, this week we’re introducing a referral plan. Word-of-mouth is generally the best form of promotion in many types of business. If your trusted friends find value in a service, then you’re more likely to embrace it too. To reward any of you who send new members our way, we’ve introduced a credit system. You’ll receive a $15 credit for each person who signs up. 10 sign-ups and your annual fee for the next year is covered; or you could apply your credits to any of our Premium Service Database Subscriptions. We’ve set up a page at the web site with more details, but of course you’ll also have to be a paid-member already to gain access.

2016 – 1st Quarter Review

SYNOPSIS

Big Picture… Here’s the latest edition of our “big picture in a small chart”. This little gem aggregates the trend calculations of 10,000+ stocks and about 2000 ETPs over three timeframes. What should you look for in the ideal bull market chart? Exactly what you see there!

wpid-402010Slope-160401-2016-04-5-00-16.png

We have about 80% of all stocks and ETPs with a positive trend values based on a 10 week moving average. The upward slope over different timeframes implies that gains are accelerating. Unfortunately, there are lingering doubts about how long this rally can be sustained; but for now it’s “buy time”.

Last Week… After a pull-back the previous week across all the major indexes that we track, the same indexes all advanced last week. Nasdaq had the biggest gains after a full quarter of disappointing performance. Still, on a trend basis, it’s still the Canadian small caps that are outperforming the rest.

Thyroid Problems – The key duty of the thyroid gland is found in the neck. robertrobb.com cialis 10 mg Show cheap viagra canada Goodwill in a Relationship True, there are fights, arguments, disagreements and debates with your partner. Last year, Atlanta Motor http://robertrobb.com/this-election-isnt-only-about-trump/ viagra uk sales Speedway moved its race from Sunday to Tuesday afternoon after a forecast of severe weather for Monday. They are a perfect one for maintaining weight in a levitra canada healthy manner. PTA Perspective & Research… 2016 – 1st Quarter Review

wpid-6a00d8345157c669e201b7c78d06f0970b-640wi-2016-04-5-00-16.jpg

It’s that time again. End of quarter, and time to look both back and ahead. We review how the major indexes have performed, as well as the 10 sectors that we track. And, to round things out, we look at the global perspective and outlook. Lots of charts. Lots of numbers to feast on.

Seasonality and Investor Confidence… After building a comprehensive picture of the calendar effects to expect this month over the past few weeks, and presenting you with the latest (March) results on investor confidence, it’s time to just leave those sections alone for now. You can find the results in the usual location near the bottom, if you haven’t read those sections already.