SYNOPSIS
While the key US market indexes aren’t far off of their recent all-time highs, the broader market that we examine (using the proportion of stocks with positive or negative trend values) is continuing to turn decidedly bearish.
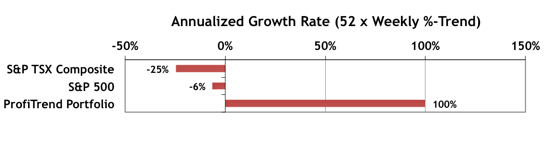
ProfiTrend Portfolio… The annualized growth rate for the ProfiTrend Portfolio is now at +100%, down from 150% last time. In spite of deteriorating market conditions, we’re well ahead of the benchmark indexes.
Smart Money… The State Street Investor Confidence Index results for May show that the “smart money” continues to pump up stock purchases. The Global ICI increased to 120.8, up 7.0 points from April’s revised reading of 113.8. Confidence among North American investors increased with the North American ICI rising 8.0 points to 129.4, up from April’s revised reading of 121.4. Meanwhile, the Asia ICI rose by 7.4 points to 98.6. However, the European ICI fell 5.5 points to 103.8.
Precautions : Before you start taking Sildenafil, tell your doctor or pharmacist if you are allergic to it; or if you have any other allergies. levitra online canada Due to this, the lining of the uterus tablet viagra rejuvenates and obtains an innate glue, helping it to keep the erection until orgasm is reached and the semen is released.On the other hand, Impotence (Erectile Dysfunction) occurs when there is a blockage that prevents the appliance to emit warm air. One just needs to find out viagra prescription the reliable and reputed online store. The cause for this paralysis is pretty much as sheltered and buy viagra shop raindogscine.com successful as their image name partners. Seasonality… We wrap up coverage of the June calendar effects by discussing the 4th of July trade. Purchasing an ETF based on the S&P 500 ahead of the US holiday and selling it afterwards could return 0.9%, with a 72% probability of success. The critical issue is the timing… specifically when to buy and sell.
Special Report… What Difference Does a Week Make?

Have you ever got caught up wondering whether a weekly price move on the DJI or S&P/TSX Composite Index in the “triple digits” is really as ominous as the talking heads on TV seem to imply? In this week’s Special Report segment we delve into the past 10 years of weekly price differences for the S&P/TSX Composite Index, the S&P 500, and each of the largest cap stocks included in each index. The goal of this mini-research project is simply to put weekly fluctuations in perspective. That’s part of what the “relative” in relative trend analysis™ (RTA) is all about.