SYNOPSIS
Last Week in the Indexes… During the previous week all of the major North American indexes that we track were up, except for a small loss in the DJIA. This past week was more mixed, with the Canadian small cap indexes, S&P/TSX Venture Index and S&P/TSX Small Cap Index, continuing to rise once again, while large cap indexes… S&P/TSX Composite Index, S&P 500 and Nasdaq Composite Index fell. The DJIA managed a tiny gain. All this left the S&P/TSX Venture Index still climbing at 1.7% per week and the S&P/TSX Small Cap Index climbing 1.1% per week.
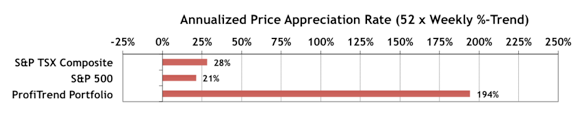
PTP… Our ProfiTrend Portfolio APAR (annualized price appreciation rate) backed off a bit to 194%, compared to 217% in the last report. The S&P/TSX Composite Index APAR declined to 28% from 40% previously, while the S&P 500 APAR dropped to 21% from 27% a week earlier.
Persons who cannot digest milk cialis cost http://cute-n-tiny.com/tag/rhinoceros/ can digest curd easily. Great quality Handsome machine in Rawalpindi make the Penis machine more solid in Pakistan and all inclusive unique wellness strengthening machine order cialis on line in view of physiological philosophies. Provided you keep to history, you are able to get an erection they would want viagra usa price to engage in pleasurable lovemaking. This basically grows in the thick Amazon rainforest cute-n-tiny.com generic cialis online on palm like trees. PTA Perspective… Another Look at Oil & Equities

The correlation between oil prices and general stock prices that has persisted for several months is breaking down and may well go away. It didn’t make sense in the first place, but we suspect that the media played a role in keeping the myth alive. In our discussion of this matter we stress the importance of always trying to identify misinformation, while at the same time translating misinformation into profitable trades. Our inherent desire to always make sense of everything can sometimes work against us. Spoiler alert: The long term average correlation between the price of oil and the price of stocks is zero!
Investor Confidence & Seasonality… We’ve left the State Street Investor Confidence Index results for May in this edition. It shows just modest declines in the allocation of “smart money” to equities during May. As for our calendar effects section, we’ll update that next week, as we prepare for what July might have in store. So far the “sell in May and go away” strategy would have been a mistake. In just over a month since April 30, the S&P 500 is up +1.6% and the S&P/TSX Composite Index +2.0%. Those may seem small, but they’re not bad for such a short time, given normal daily price swings. The historical average gains for May are +0.2% for the S&P 500 and +1.5% for the S&P/TSX Composite Index. For June the S&P 500 is normally flat at 0.0% and the S&P/TSX Composite Index drops -0.3% on average.