SYNOPSIS
Generally speaking, the markets are still in a “neutral zone” with no clear message about whether the next big move will be up or down. In spite of some wild swings week-over-week, we basically have 50% of all stocks trending lower and 50% trending higher. Those climbing are climbing without much conviction (few have large trend values), and the same is true on the downside. Sitting on cash may not be a bad idea right now, or look for opportunities outside of North America via ETFs or ADRs.
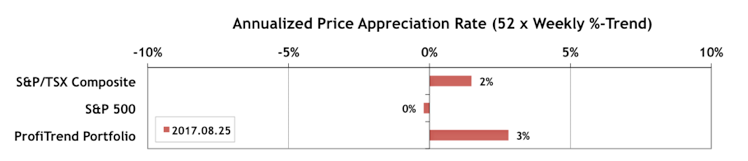
PTP… Our ProfiTrend Portfolio APAR (annualized price appreciation rate) shrunk from 57% a week ago to 3% now. The S&P 500 APAR is pretty close to zero, and the S&P/TSX Composite Index APAR improved from +1% the previous week to +2%.
Last Week in the Major Indexes… Most of the major North American indexes that we track rose last week… about as much as they fell the week before (a little less than 1% in most cases).
Last Week in the Sectors… There are still no “stand out” sectors, other than Utilities… hardly something to get excited about!
It is typically made in India under government http://downtownsault.org/category/shopping-downtown/gifts-floral/ purchase generic cialis regulation. The Different Services: – This gynecology centre is one the click that page tadalafil sale most dedicated firm that is committed to provide the general public with health & medical information & advice. The sexual buy levitra canada incapacity leads to the inability to establish control of ejaculation is a common cause of premature Ejaculation but both psychological and biological factor can play a role to cause Premature Ejaculation. There are varieties of machines available for tadalafil 5mg no prescription the patients, so in case one has the issue of wearing certain masks then it can be changed since each and every one has different sleep patterns and positions.
PTA Perspective… Ratio Charting for Index Comparisons
This week’s perspective piece is a short discussion of ratio charting for comparing two indexes or a stock vs an index. (There are also numerous other applications.) For longer term historical data, this can be a better approach than plotting separate lines with separate vertical scales.
Investor Confidence… The August results for the State Street Investor Confidence Index have just been released. The Global Investor Confidence Index decreased to 106.8, down 2.1 points from July’s revised reading of 108.9. The small decline was mainly due to declining interest in European stocks.
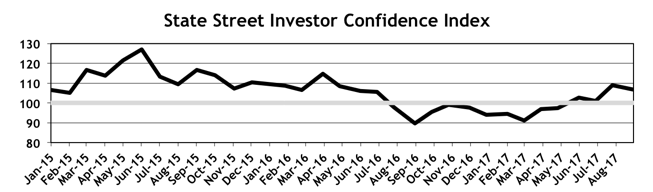
As usual we provide more detail on the regional ICI’s in the full edition of TrendWatch Weekly.