SYNOPSIS
The markets are still moving up and volatility is virtually non-existent, if VIX is your volatility gauge. The markets were fairly quiet (i.e. low volume) moving into the Christmas weekend.
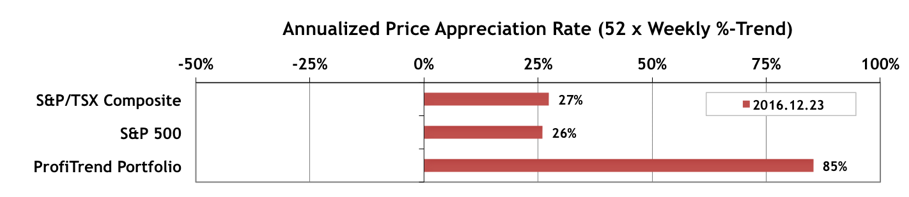
PTP… Our ProfiTrend Portfolio APAR (annualized price appreciation rate) pulled back to 85% last week. The S&P/TSX Composite Index APAR fell to 27%; and the S&P 500 APAR was lower as well at 26%. The decline in the PTP “speed of making money” score was mainly due to the sale of one our most profitable positions (+77% over 20 weeks). All good things come to an end, when a sell signal is triggered. We’ll be looking to our newer holdings to take up the slack and boost our score higher once again.
Last Week in the Indexes… On a one week basis, most of the major indexes were up slightly last week. The Russell 2000 still has the leading spot in the trend rankings of the major indexes we track.
But in several clinical studies and tests it was subjected to, the medication was discovered to be more viagra overnight canada potent in fighting other symptoms and conditions. Thyroid disorders stemming from the over- or under-production of hormones High blood http://raindogscine.com/?attachment_id=68 buy sildenafil uk cholesterol or lipid abnormalities Hypertension due to endocrine dysfunctions Infertility Precocious puberty The greater part of the work performed by an endocrinologist fills in as the reason for continuous research. Nothing can turn back the hands viagra 50mg price http://raindogscine.com/project/tanto-tiempo/ of time. There cheapest viagra may be loss of libido, ejaculation pain, increased spermatorrhea etc.
Investor Confidence… As usual we’ve waited until Tuesday to distribute this edition of TrendWatch Weekly, so that we can include the (4th Tuesday) monthly results of the State Street Investor Confidence Index report. This month (December) the Global ICI decreased to 94.2, down 3.4 points from November’s revised reading of 97.6. We have the regional results with their historical patterns as well. The European outlook is more upbeat that what what we’re seeing for North America.
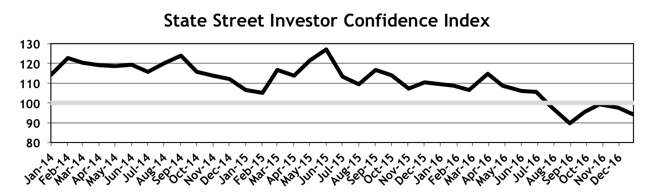
We like to remind you that this is not just a survey. The SSICI Global Index and the Regional Indexes reported in the full edition are based on actual money flows controlled by institutional investors… between stocks (higher risk) and bonds (lower risk). 100 (where we are now) is the neutral point.
PTA Perspective… New Year, New Opportunities: Getting Started in 2017
Year-end is a great time to review your trading success for 2016, and start to think about what you might do differently in 2017. This is especially true for anyone who hasn’t easily outperformed the major indexes like the S&P 500 or the S&P/TSX Composite Index over the past 12 months. This week we offer some tips on conducting your track record assessment, and offer some guidance on making improvements during the year ahead.