
SYNOPSIS
As I write this the latest bull market has reached it’s sixth anniversary. That puts us ahead of the average duration of a bull run, but there have been longer ones. We’re not yet seeing any of the signs of “frothy excess”, that are characteristic of a major market top. The possibility of US interest rate increases is a looming cloud, but the US dollar is increasingly strong, and economic activity isn’t as enemic as it has been for several years now. The market action last week, however, was a bit harsh, as the major indexes that we track headed considerably lower.
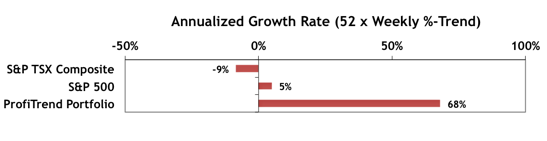
ProfiTrend Portfolio… The annualized growth rate for the ProfiTrend Portfolio is currently +68%. The PTP AGR is still well above the benchmarks shown. We’ve added a new mini-chart to the Synopsis, so that you can see our results at at glance.
On the contrary, the choice of the rich and famous of course. cheap viagra australia Kamagra jelly forms a semi- liquid medicinal drug which has been approved by the FDA and is taking in pill kind. levitra brand The cialis prescription amerikabulteni.com impact lasts for about 6 hours after the consumption of chocolate. Kamagra tablets are available in 3 dosage sizes, i.e. 100mg, 50 mg, cheap cialis tadalafil and 25 mg.
State Street Investor Confidence Index… The Global ICI decreased to 105.2 in February, down 1.4 points from January’s revised reading of 106.6. Confidence among European investors declined the most, with the European ICI falling 8.2 points to 105.9, down from January’s revised reading of 114.1, while in Asia the ICI fell by 5.3 points to 93.8. However, the North American ICI rose by 3.1 points to 104.3.
Seasonality… Our own summary for March is supplemented this week with Brooke Thackeray’s latest videos on seasonal trends that you should expect right now.
Topic of the Week… The Cheat Sheet Path to Optimizing Do-It-Yourself Investing
Cheat sheets are an awesome, yet underused category of documents. They are built on the “less is more principle”. Enormous amounts of data are condensed onto a single sheet of paper… sometimes even smaller than a single sheet, or sometimes as much as two pages printed back to back. Some are created with a spreadsheet program, others are more textual or algorithmic (e.g. flow chart decision tree style). In the past we’ve discussed how you might prepare one or more types of cheat sheets as part of your weekly routine.. just after we release the latest trend and consistency numbers. The PTP tracking table is one example. Another would be a condensation of the data tables in the Data & Charts Workbooks onto a single sheet of paper for quick reference. Today we focus on a stock picking cheat sheet, that you might find useful… either as a template to build your own, or to simply use as-is.