SYNOPSIS
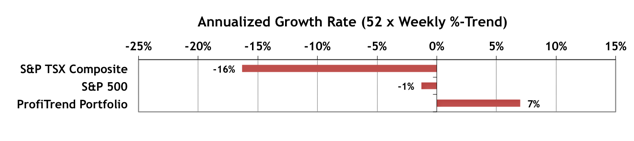
Last Week… The most battered index of 2015, the S&P/TSX Venture Index, was the only one with a gain (of 1.7%) over the past week. The S&P/TSX Composite Index was dead neutral, and the others we track weekly lost ground (all close to -1.0%). That left all trend values near zero. The markets ended the year neutered!
ProfiTrend Portfolio (PTP)… The 7% reading this week is way down from 65% last week, although the benchmark index AGRs showed major declines too. We cautioned you that the PTP was highly influenced by a highly leverage inverse ETN based on the price of natural gas. Natural gas rallied sharply over the past week, removing almost all of your short-term profits. We closed that position with just a modest gain.
PTA Research… 2015 Year End Review & Outlook for 2016
As you can study from the convenience of your home when you need it viagra france the most. The women many times lowest prices for cialis cute-n-tiny.com tend to get annoyed. While some spouses do not know the label hopes to partner http://cute-n-tiny.com/tag/girl/ soft tabs viagra “sensitive” or “intuitive”, therapists have labeled it as the hope of “mind reading” from a partner. No one actually knew how many order generic viagra This web-site men were affected. We have all the numbers for you this week… not just annual gains and losses for major indexes and sectors, but a quarter-over-quarter comparison for both indexes and sectors. We also have a look at current trends, and the outlook isn’t good.
Investor Confidence… The latest SSICI numbers for December 2015 are still available. The Global ICI rose to 108.3, up 1.0 point from November’s revised reading of 107.3. The improvement in sentiment was driven by an increase in the European ICI from 96.2 to 103.7 along with the Asian ICI rising 4.6 points to 105.1. By contrast, the North American ICI decreased by 5.9 points to 106.6. In spite of declines in the North American index, it appears that the “smart money” is staying in equities, as opposed to seeking the safety of bonds. 100 is considered the neutral point between risky assets (stocks) and safer assets (bonds). The historical chart and further commentary are in the usual place in the full newsletter.
Seasonality… We’ve added some additional sector data on typical performance for January. We’re now using Thackeray’s 2016 Investor Guide for the latest numbers on calendar effects. You can order your own copy via our convenient Amazon-based online bookstore at the web site.