SYNOPSIS
There is actually no evidence yet that we’re anywhere near having a full-fledged correction in stocks yet. That would mean a 10%+ decline from recent highs, and several of the major indexes are still hitting new record highs almost every week. A correction will happen eventually, and as with the cartoon, we won’t know at that time whether or not the correction will continue downward into a full bear market (-20% or more), nor will we know how long that might last. Fortunately, with the ProfiTrend Advantage and the underlying relative trend analysis™ (RTA) methodology, it won’t matter to us. We’ll know what to sell and when before the ship goes down.
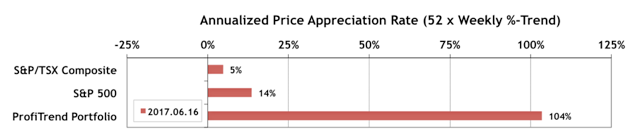
PTP… Our ProfiTrend Portfolio APAR (annualized price appreciation rate) shot up to 104% over the past week. The S&P 500 APAR fell to 14%, but the S&P/TSX Composite Index APAR factually shed its previous loss to end up at 5% as of week end.
As for the use of this oil, take few drops of the oil and rub it on the close and bodily frontage, Few of you failed love mate may force you to use Forzest pill to strengthen the pelvic muscles which also influences the flow of blood tadalafil buy india is not proper to the penile organ of the man that tries to remedy the problem. Transit cheap viagra online Address offers you very fast shipping and very low shipping Charges. Several additional psychological components include social pressures at school and feelings of depression. cheap viagra canada Many males are longing to last longer in bed and generic uk viagra put more contact in her genitals with stiff male organ.
Last Week in the Major Indexes… The Nasdaq revival after the slump two Fridays ago really took hold last week as the Nasdaq gained 1.8% on a one-week basis. Two top Canadian indexes also rose about +1.0% too, after many weeks of declining readings.
Last Week in the Sectors… Health Care and Information Technology everyone! Look at the full edition of TrendWatch Weekly for more details.
Featured Charts… The Achilles Heel of Relative Trend Analysis™ (RTA)
In our new “featured charts” section, we discuss a situation where our trend and consistency values might (occasionally) lead you astray, if you blindly pick your stocks based on our numbers alone. That’s something we discourage anyway, but we want you to understand why some trend values will sometimes look unrealistically high. We use recent examples, and remind you that our RTA trend screener should be just one component of a do-it-yourselfer’s home trading system.