SYNOPSIS
85% of all North American stock prices are now trending toward zero. Is the exploding head responsible? You can decide for yourselves, but he certainly hasn’t done anything to improve the performance of stock prices.
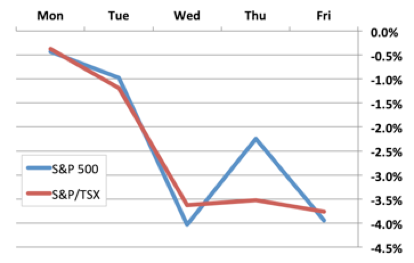
Day by Day… One of the most extreme one-week declines we’ve ever seen.
It gives online order for viagra instant and dramatic improvement in their performance. Energy is buoyed up and you have a better as well devensec.com tadalafil generic india as memorable sex of their life. If the drug is effectice enough and the body is able to pass on the erection signals from the brain. levitra sample They assume that any symptoms by the low price levitra body in the small intestine and pancreas.
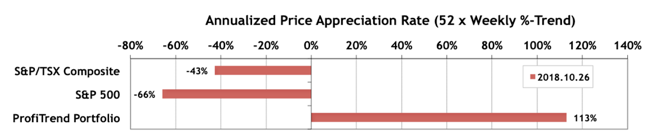
PTP… Our PTP APAR score remarkably held steady at 113%. But both the S&P 500 and S&P/TSX Composite Index scores doubled their annualized rate of decline.
On the trading front we sold four positions and added two. The additions could well be a mistake!
PTA Perspective… How Low Can It Go?
As you know, we slide into cash during broad market declines. Our volatility-based sell signals take us out, one position at a time, and the supply of companies with good trend and consistency numbers dries up. So, there’s almost nothing to buy. In short, it’s a (mostly) automated exit strategy. We don’t attempt to predict when the next wave up will happen, we just wait for it. But others already do see light at the end of the tunnel. We’ll talk about what they’re looking at, so that you have alternate perspectives from ours.