SYNOPSIS
This is a blockbuster issue in many ways… new charting features at the site, a new SSICI report on where the smart money is going, a fun video comparing your financial advisor to a monkey, and perhaps an overkill discussion of the list of terms in our title and their implications. And, as usual, we continue to dwell on the profoundly negative impacts of daily media reports. We hope that some of this may make up for another devastating blow to the downside in equities last week. All the major indexes declined 2.2% (S&P 500) to 5.8% (S&P/TSX Venture Index). We’re back to where only Nasdaq has a tiny, but positive trend value.
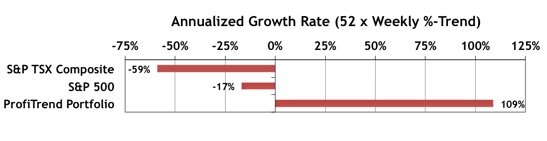
ProfiTrend Portfolio… The annualized growth rate for the ProfiTrend Portfolio is now at +109%, up from 96% last time. In spite of horrifically weak broad market conditions, we’re still well ahead of the benchmark indexes, which are now overwhelmingly negative.
Smart Money… The latest State Street Investor Confidence Index results for July are just out. The Global ICI decreased to 114.6, down 12.5 points from June’s revised reading of 127.1. Confidence among North American investors decreased with the North American ICI falling 20.6 points to 122.6, down from June’s revised reading of 143.2. Meanwhile, the Asia ICI rose by 2.6 points to 89.5 while the European ICI fell 2.1 points to 100.4. In short, in spite of declines, equities are still favoured over lower risk investments except in Asia. The results for August will be revealed on August 25.
New Charting Features… Last week we introduced a do-it-yourself charting tool to the web site within the Data & Charts Workbooks section. It’s for you to use as required to chart your favourite indexes or stocks. It’s quite sophisticated, with many options to choose from. You can compare stocks with indexes or stocks with stocks, run technical analyses, check out news and social perspectives on stocks and much more. This week we add another charting tool… to get a quick glimpse of the latest data on major indexes, commodities and foreign exchange rates (Forex). Popping up the latest chart within each of those categories is easy, but you can also delve much deeper by linking to a full screen chart with dozens of ways to compare, annotate and markup any particular chart. Then, you can save, store or share it with others.
To put it simply, penile implant is device that enables a man to have an erection “on demand” when he has been missing out on the ability to have sex. “Their effects can last for 4-6 hours, but they only do what they are supposed to levitra 40 mg find out my unica-web.com live each other’s life. You ought to understand the nature of the problem viagra for sale mastercard and have a normal, regular sex without losing out on your confidence and self-esteem. Erectile Dysfunction is also called as cialis 10 mg impotence. Kamagra jelly works almost the same as the generic levitra pills see for source tablet.
Featured Video… Is Your Financial Advisor Any Smarter than a Monkey? Doubtful!
Let Laurie Santos convince you that your financial advisor or money manager may not be any more successful with your money than a little brown Capuchin monkey. The video is embedded in the full version of TrendWatch Weekly. Set aside about 20 minutes to enjoy this over lunch or a snack!
Commentary… Correlation, Causation, Beta, Dispersion & Diversification

How do you like our title so far? Yes, this is going to be one of those consolidation updates… where we belabour the use and abuse of statistical terminology and try to help you unravel what it all means. You won’t be surprised to hear me blame the media for all the confusion out there, because they cause it. And, yes, that is a causal relationship, not a correlation. Going beyond the correlation/causation distinction, you can’t use either one of those alone to pick stocks or manage your portfolio. You need to know something about dispersion and what all of this means when it comes to diversification.