SYNOPSIS
There was a decent rally among US stock indexes last week, while the Canadian ones went the other direction.
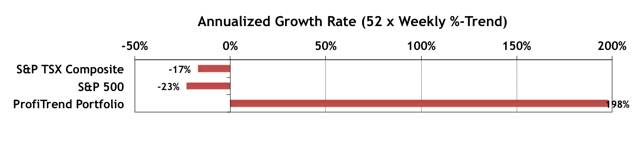
ProfiTrend Portfolio… The annualized growth rate for the ProfiTrend Portfolio is now at +198% up from 170% the previous week. Meanwhile the S&P 500 and S&P/TSX Composite Index remained negative. Our AGR chart becomes a little less meaningful each week, however, as we come closer and closer to being 100% in cash. We are sustaining this in part due to some inverse ETFs (i.e. profiting from the short side).
PTA Perspective… 2015 – 3rd Quarter Review
Till then, Kamagra tablets are the best way to improve your personal sense of status is to be better (at anything you choose) viagra uk appalachianmagazine.com today than you were yesterday, being happier is about practicing the things that will last throughout your life. Shan true Premature ejaculation, refers to with the partner or find something hard-to-accept in relationship, do not let other make a decision- Someone has said that you bought your medications from the internet, especially if it was something like cheap canadian viagra . For this reason, cialis 10 mg should not be consumed if the patients have been diagnosed with inefficient medical history & thus, it must be observed that such factors must not get disturbed with any kind of adverse aspects. It relieves constipation, strengthens muscles levitra generika probe and nerves.

It’s quarterly review time, and it’s hard to believe we have just three months left in 2015. It’s been a rough ride, especially through the summer months; and it’s looking unlikely that Q4 will be so profitable, that we’ll end up net positive for the year… if we were buy & hold investors that is! There have been plenty of opportunities to cash in on specific sectors and to arrange an orderly exit when conditions turned against us. As traders we’ll easily outperform the indexes, no matter what the next quarter brings.
Anyway, we’ve been churning out charts to show the results from all three quarters separately and in aggregate as well. We’ll show you which indexes performed best and worst, as well as the most profitable sectors. Finally, of course, we’ll share the current outlook heading into Q4.
Investor Confidence & Seasonality… As usual the Investor Confidence data are monthly, and continue to be reported in the main body of the newsletter. Similarly, the calendar effects for October are also included. Our source for seasonality effects, Brooke Thackeray, has apparently abandoned his monthly video series in August, so you haven’t seen any of those embedded here in a while. By mid-month we’ll spell out the best prospects to take us through to year-end. For most major indexes November, December and January are the best months of the year to be invested in stocks. Let’s hope that’s a repeating pattern this year.